Posted On: February 09, 2016
I lost most of my day debugging a random test failure that we would sometimes see in development, but never on our CI server. I can only hope that this post will save some poor soul from the hours of cursing at @rwjblue in slack that I experienced today.
TL;DR;
If you need to use Ember.onerror guard it so it is not used in testing.
if (Ember.testing !== true) {
  Ember.onerror = function() { console.log('log the fancy error'); }
}
The Symptoms
I've recently started working on a different project at my company. It is an Ember app that was started after the project I normally work on (If you wanna here the full story come here me talk at EmberConf). Recently, some of the my team members and I have noticed a random test failure. Once it starts failing it continues to fail, even after refreshing the browser. Looking at the test more closely we all realize that the test is obviously broken and so we fix it and move on. We currently have three different topic branches with this random test fixed. The really weird part is this test never fails on our Continuous Integration server.
Finally this phantom failure bugged me enough that I decided to dig in. Poking around for a bit I was finally able to find a repeatable pattern, but I still didn't understand WTF was going on.
- If you ran the full test suite the test would never fail. This is why it alway passed in CI.
- If you ran the test by itself, it would always fail.
- Once the test failed once, you could run the entire test suite again and it would always fail.
Diagnosis
I wish I could look back and find some concrete methodical way of tracking down this problem, but it just wasn't that type of bug. The error when the test failed was simple enough, TypeError: this.attrs.saveItems is not a function. The test is basically complaining that we were trying to call saveItems as a function. If you stuck a break point in there you would see that saveItems was undefined. We weren't passing the action when rendering the component in the integration test, and the test was failing. The thing is this test should ALWAYS fail. Why wasn't it failing on our CI servers? Why didn't it fail most times we ran it? Why did it always fail once it failed once? Do you see the need now for lots of cursing?
This type of problem screams of shared state. Something was happening when we ran the full test suite that masked the problem. To make it more confusing, once the error did occur, that shared state is no longer enough to prevent the error. Here are the ways I know of for a web application to maintain state.
- The Server - It's main job is to maintain state.
- Cookies - Who still uses cookies?
- LocalStorage - Long term key value store.
- SessionStorage - Key value store that will maintain state until a browser session ends.
- DB Stuff (IndexDB, WebSQL) - Cool stuff but I don't know too much about it.
The Server is ruled out since our tests use ember-cli-mirage and therefore our data layer is blown away with each browser refresh. Our app also doesn't use cookies for anything. We use LocalStorage to persist one user setting that is accessed via an Ember.Service. I dug into this a bit but it was a dead end. Our app also doesn't use IndexDB or WebSQL. If you use any of these technologies extensively than you probably are well aware of the Resources pain in Chrome development tools. It allows you to inspect all of these technologies and manipulate their values.
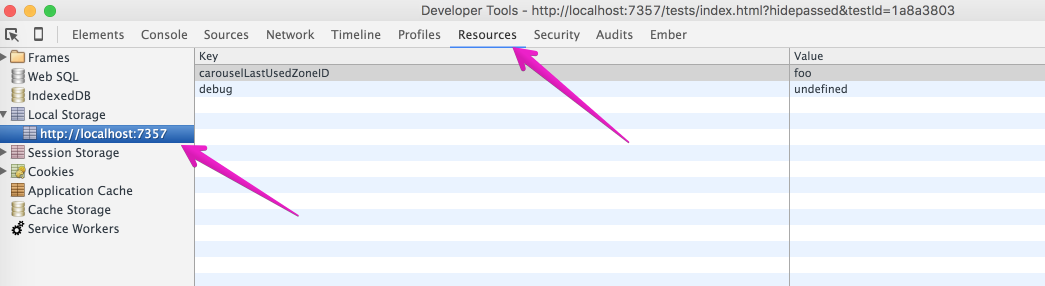
This is where the first breakthrough was made. Turns out that QUnit uses SessionStorage to track failing tests. It runs those tests first so that it can "Fail Fast". I always noticed that test failures seem to happen really quickly, but never before realized how QUnit was doing it. If I cleared SessionStorage using the chrome development tools in between test runs my test would always passed.
I now had a solid explanation for why the test would always fail after it failed the first time. One of the tests in our suite was changing the test environment so that the broken test could pass. If I ran the test in isolation it would fail, because the other test that was changing the environment hadn't run. QUnit, seeing this failure, would now run the test first, before any tests that could alter the environment.
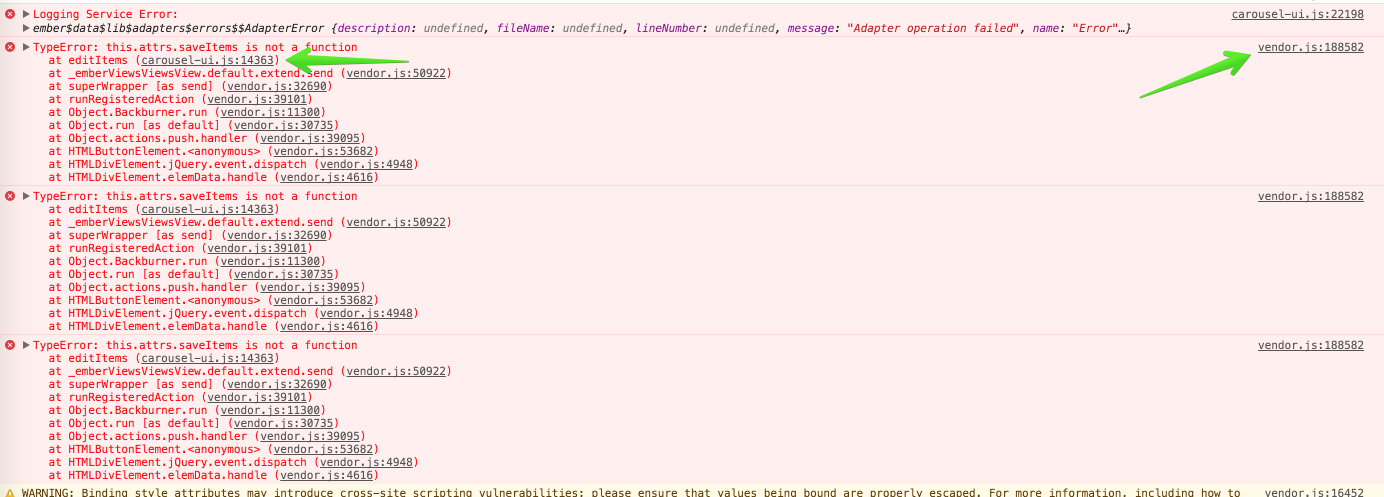
My next breakthrough came from good old Console. Keeping the console open during the full test suite I noticed that there were errors being logged and the messages were the same as when the test should have failed. A useful tip is that you can click the links of the filename / line numbers in console messages to navigate to source code where that message was logged.
Once I found the interesting bit of source code I set a breakpoint by clicking the line numbers in the left gutter. Setting a breakpoint is the same as putting in a debugger statement. It will cause the browser to halt execution (only if the development tools are open) and allow you to poke around and inspect the state of the app. Breakpoints are especially useful when the code you want to break into is in vendor code.
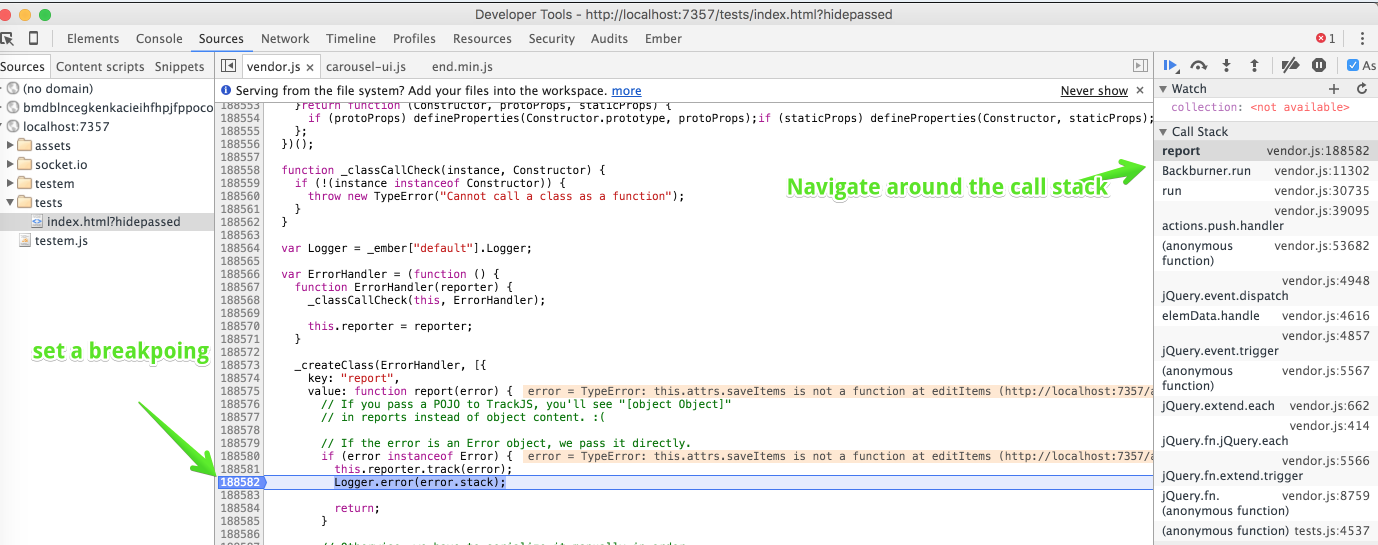
Using the breakpoint it was pretty easy to see where the error was getting logged and thrown away, but how did we get here? While stopped in a breakpoint you can use the Call Stack on the right hand side to navigate the different frames of the call stack. This allows you to look backwards and see how the code was called. The frame before my breakpoint was in backburner.js which is usually a no mans land of setTimeouts but in this case was pretty useful. The logging code was being invoked by an onError method which was supplied by options. Hmm... a configurable onerror, this sounds familiar.
Resolution
Once I saw onError in backburner I slapped my forehead and searched my project for Ember.onerror. What I found was an instance-initializer that was being used to setup error tracking. If you haven't heard of Ember.onerror before you can read about it here. It allows you to assign a function that gets called for any un-handled errors, including any exceptions thrown in the Run Loop. It's super useful for error tracking, which is why we were overriding it in our instance-initializer.
The problem, if you haven't already guessed, is it is a global handler, and doesn't get reset in between tests. Once you assign a function to Ember.onerror that function will always get used to handle errors until the global Ember object is reassigned (when you refresh the browser). Since instance-initializers only get run for acceptance tests, our Ember.onerror only got assigned if we ran the full test suite. Because our acceptance tests ran before the the test in question, the error would get silently dropped and the test would pass. When we ran the test in isolation Ember.onerror was not assigned, the error would not be dropped, and the test would fail. At this point Qunit would re-order the tests so the failing test would always execute before the acceptance tests and keep on failing.
Fixing the issue was really simple. Only assign to Ember.onerror if we aren't testing.
if (Ember.testing !== true) {
  Ember.onerror = function() { console.log('log the fancy error'); }
}
To see an example of how Ember.onerror can capture your errors and do things you don't expect check out this twiddle.
It is pretty much the same bug I spent my day today cursing. Inside an action we were trying to call a function that is undefined. Instead of logging anything to the console, it will instead give you a sweet alert message. Imagine instead if the alert was logging to a disabled error tracking service. The error would be swallowed and your test would pass, even though it should really fail due to an un-handeled error.
Takeaways
Evaluate your use of Ember.onerror and make sure it can't interfere with your tests. My recommendation is don't use Ember.onerror when testing, but your use case may differ from mine.
Hopefully some who aren't super familiar with the Web platforms rapid expansion of awesome tooling will get something out of my Chrome developer tools examples. I love working on web applications lately, the tools are just getting so awesome. Read more about the tools here.
Thanks for reading. Hopefully I'll see you at EmberConf 2016.